New Cotality data shows the gap between winning and losing markets is widening fast

The US housing market entered July with modest gains and sharpening fault lines. National single-family home prices rose 1.4% year over year last month, according to Cotality's Home Price Index.
However, the headline figure obscures a market splitting cleanly along regional and economic lines, with local job dynamics proving a more reliable predictor of price direction than any national indicator.
July's data marks a notable shift from summer momentum. Nineteen metro areas posted negative three-month price momentum, up from 10 in June.
The 30-year fixed-rate mortgage rose to 6.71% for the week ending September 3, according to Freddie Mac's Primary Mortgage Market Survey (PMMS) — its highest level since July 31, 2025, when it stood at 6.72%.https://t.co/FWWow9eJM7
— Mortgage Professional America Magazine (@MPAMagazineUS) September 7, 2026
Northeast and Midwest hold the line
The strongest performers remain concentrated in the Northeast and Midwest, where supply constraints continue to support appreciation.
Connecticut and Illinois each posted 6.8% annual gains in July, leading all states. Indiana gained 5.3%, New Jersey 5.0%, and Nebraska 4.9%.
The underlying driver — a persistently thin resale inventory that has kept upward price pressure intact even as sales volumes soften — shows no signs of resolving in these markets quickly.
At the local level, Abilene, Texas, stands out as the nation's top-performing metro with a 13.3% year-over-year gain, a figure Cotality attributes directly to AI-related investment and the higher wages that follow.
Cotality Home Price Index — July 2026
Top 10 hottest US housing markets
Ranked by annual year-over-year home price change
| # | Metro | State | Annual YoY change |
|---|---|---|---|
| 1 | Abilene | TX | +13.3% |
| 2 | Helena | MT | +10.4% |
| 3 | Manhattan | KS | +9.5% |
| 4 | Grand Forks | ND | +9.3% |
| 5 | Terre Haute | IN | +9.3% |
| 6 | San Francisco Annual gain; 3-month change: −2.6% | CA | +7.0% |
| Ranks 7–10: see full infographic at cotality.com | |||
Source: Cotality Home Price Index, September 2026 release (July 2026 data)
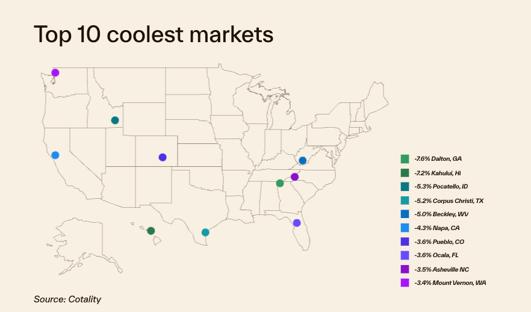
The West and Sun Belt continue to cool
Texas posted the steepest state-level annual decline at -0.8%, followed by Colorado at -0.7%, Washington at -0.4%, and Hawaii at -0.2%.
The largest three-month price drops were concentrated in San Jose, Austin, Bakersfield, and Everett — markets where elevated prices, buyer fatigue, and uncertainty around AI-driven wealth gains are now weighing on demand.
San Francisco's reversal is perhaps the most striking data point in the July report. After four consecutive months as the nation's top-performing large metro on an annual basis, the city recorded a 1.4% month-over-month price decline and a 2.6% three-month drop. That's an abrupt pivot that Cotality's data flags as a structural shift, not a seasonal blip.
Cotality is also watching several Northeast metros for signs of vulnerability. Markets including Buffalo-Cheektowaga, N.Y.; Cambridge-Newton-Framingham, Mass.; and Providence-Warwick, R.I.-Mass. carry the highest risk of price declines over the next 12 months, as local incomes across these markets have failed to keep pace with the home price appreciation recorded over the past two years.
"While prospective buyers may feel squeezed by volatile mortgage rates, slower home price appreciation should gradually help ease affordability pressures — especially if wage growth remains consistently stronger," said Dr. Selma Hepp, Cotality's chief economist.
"As we move through the remainder of the year, local labor market dynamics and affordability constraints will continue to shape housing market performance as much as broader macroeconomic shifts, especially the direction of mortgage rates."
Cotality's forecast projects national annual home price gains of 2.0% by July 2027, a modest recovery that hinges almost entirely on where mortgage rates settle and which local economies generate enough income growth to absorb the cost of borrowing at current levels.
Stay updated with the freshest mortgage news. Get exclusive interviews, breaking news, and industry events in your inbox, and always be the first to know by subscribing to our FREE daily newsletter.