Quicken Loans reports wider gap between owner perceptions, valuations

The gap between what homeowners applying for a refinance mortgage believe their home is worth and the assessment of an appraiser, has widened.
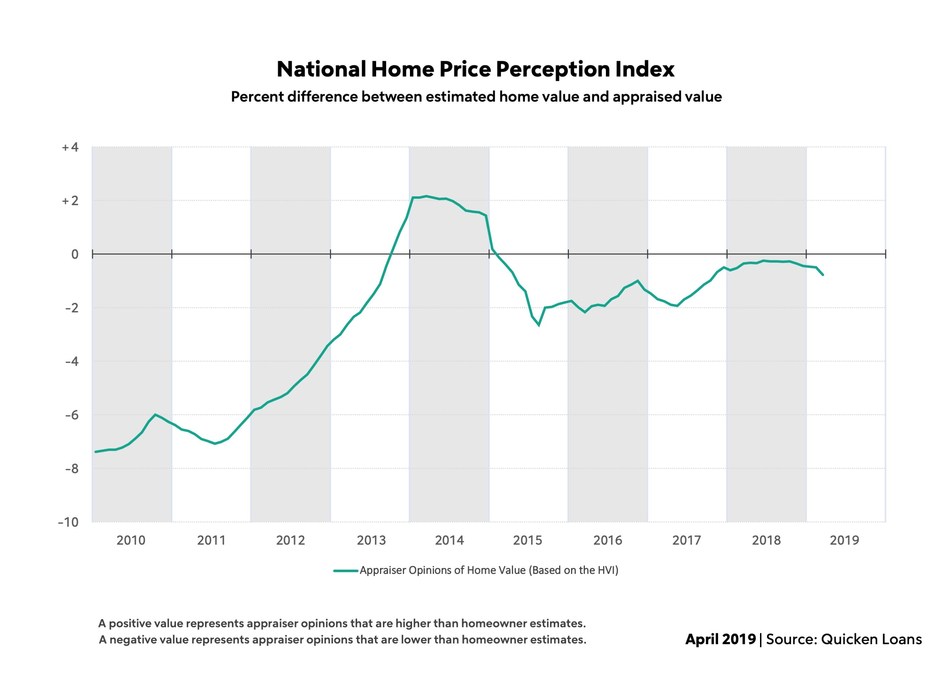
Quicken Loans’ National Home Price Perception Index (HPPI) expanded to 0.78% in March from 0.50% in February.
"This month's fluctuation in the HPPI was driven more by a dip in home values than a change in the owners' viewpoint. Homeowners are often reluctant to believe their house has lowered in value, even at a slight monthly fluctuation," said Bill Banfield, EVP of Capital Markets for Quicken Loans.
In most areas appraisals are within 1% of homeowners’ perceptions but across the areas measured for the HPPI, Chicago is where owners are overestimating the most (1.94% above appraisals) and Boston owners are underestimating the most (2.23% below appraisals).
"Depending on the area, appraised values are either growing at a much more measured pace or have taken a step back from their meteoric rise,” added Banfield. “Homeowners are usually slower to realize change – in either direction – than the appraisers who study the market on a daily basis. This can lead to a slight widening of the perception gap when there is a turn in the market."
Home Value Index
Meanwhile, Quicken Loans’ National Home Value Index (HVI) shows appraisal values dipped 0.20% from February to March. Home values continued to grow annually, rising 3.37% year-over-year.
This is a slowdown from the growth in February, when appraised values rose 5.47% year-over year.
"Some of the rampant buyer demand that we've seen over the last few years has subsided because of the affordability issues many areas are having, driven by a lack of availability," said Banfield. "Would-be buyers have decided to sit on the sidelines to see if more home inventory becomes available at the price-points where they're shopping. The entire housing industry is watching to see what will happen in the coming months – whether owners and builders will provide the home inventory the buyers have been waiting for, amid the recent drop in interest rates."
|
Metropolitan Areas
|
HPPI March 2019
Appraiser Value vs. Homeowner Perception of Value* |
HPPI February 2019
Appraiser Value vs. Homeowner Perception of Value* |
HPPI March 2018
Appraiser Value vs. Homeowner Perception of Value* |
|
Boston, MA |
+2.23% |
+2.51% |
+2.40% |
|
Charlotte, NC |
+2.11% |
+2.10% |
+1.22% |
|
Denver, CO |
+1.58% |
+1.98% |
+2.26% |
|
Minneapolis, MN |
+1.37% |
+1.50% |
+1.53% |
|
San Jose, CA |
+1.27% |
+1.63% |
+2.71% |
|
Seattle, WA |
+1.23% |
+1.48% |
+2.20% |
|
Las Vegas, NV |
+1.16% |
+1.09% |
+0.72% |
|
Dallas, TX |
+0.99% |
+1.02% |
+2.61% |
|
Atlanta, GA |
+0.81% |
+0.93% |
+0.06% |
|
San Francisco, CA |
+0.70% |
+0.73% |
+1.99% |
|
San Diego, CA |
+0.55% |
+0.67% |
+1.41% |
|
Phoenix, AZ |
+0.39% |
+0.52% |
+0.40% |
|
Washington, D.C. |
+0.31% |
+0.57% |
+0.46% |
|
Portland, OR |
+0.30% |
+0.26% |
+1.03% |
|
Sacramento, CA |
+0.28% |
+0.46% |
+0.72% |
|
Kansas City, MO |
+0.24% |
+0.43% |
+1.09% |
|
Los Angeles, CA |
-0.03% |
+0.06% |
+0.91% |
|
New York, NY |
-0.31% |
-0.37% |
+0.42% |
|
Riverside, CA |
-0.32% |
-0.02% |
+0.84% |
|
Houston, TX |
-0.47% |
-0.48% |
-0.92% |
|
Tampa, FL |
-0.59% |
-0.57% |
+0.21% |
|
Miami, FL |
-0.70% |
-0.46% |
+0.66% |
|
Detroit, MI |
-0.88% |
-0.70% |
+0.69% |
|
Baltimore, MD |
-1.08% |
-1.12% |
-1.18% |
|
Philadelphia, PA |
-1.42% |
-1.38% |
-1.62% |
|
Cleveland, OH |
-1.63% |
-1.53% |
-1.44% |
|
Chicago, IL |
-1.94% |
-1.93% |
-1.47% |
*A positive value represents appraiser opinions that are higher than homeowner perceptions. A negative value represents appraiser opinions that are lower than homeowner perceptions.