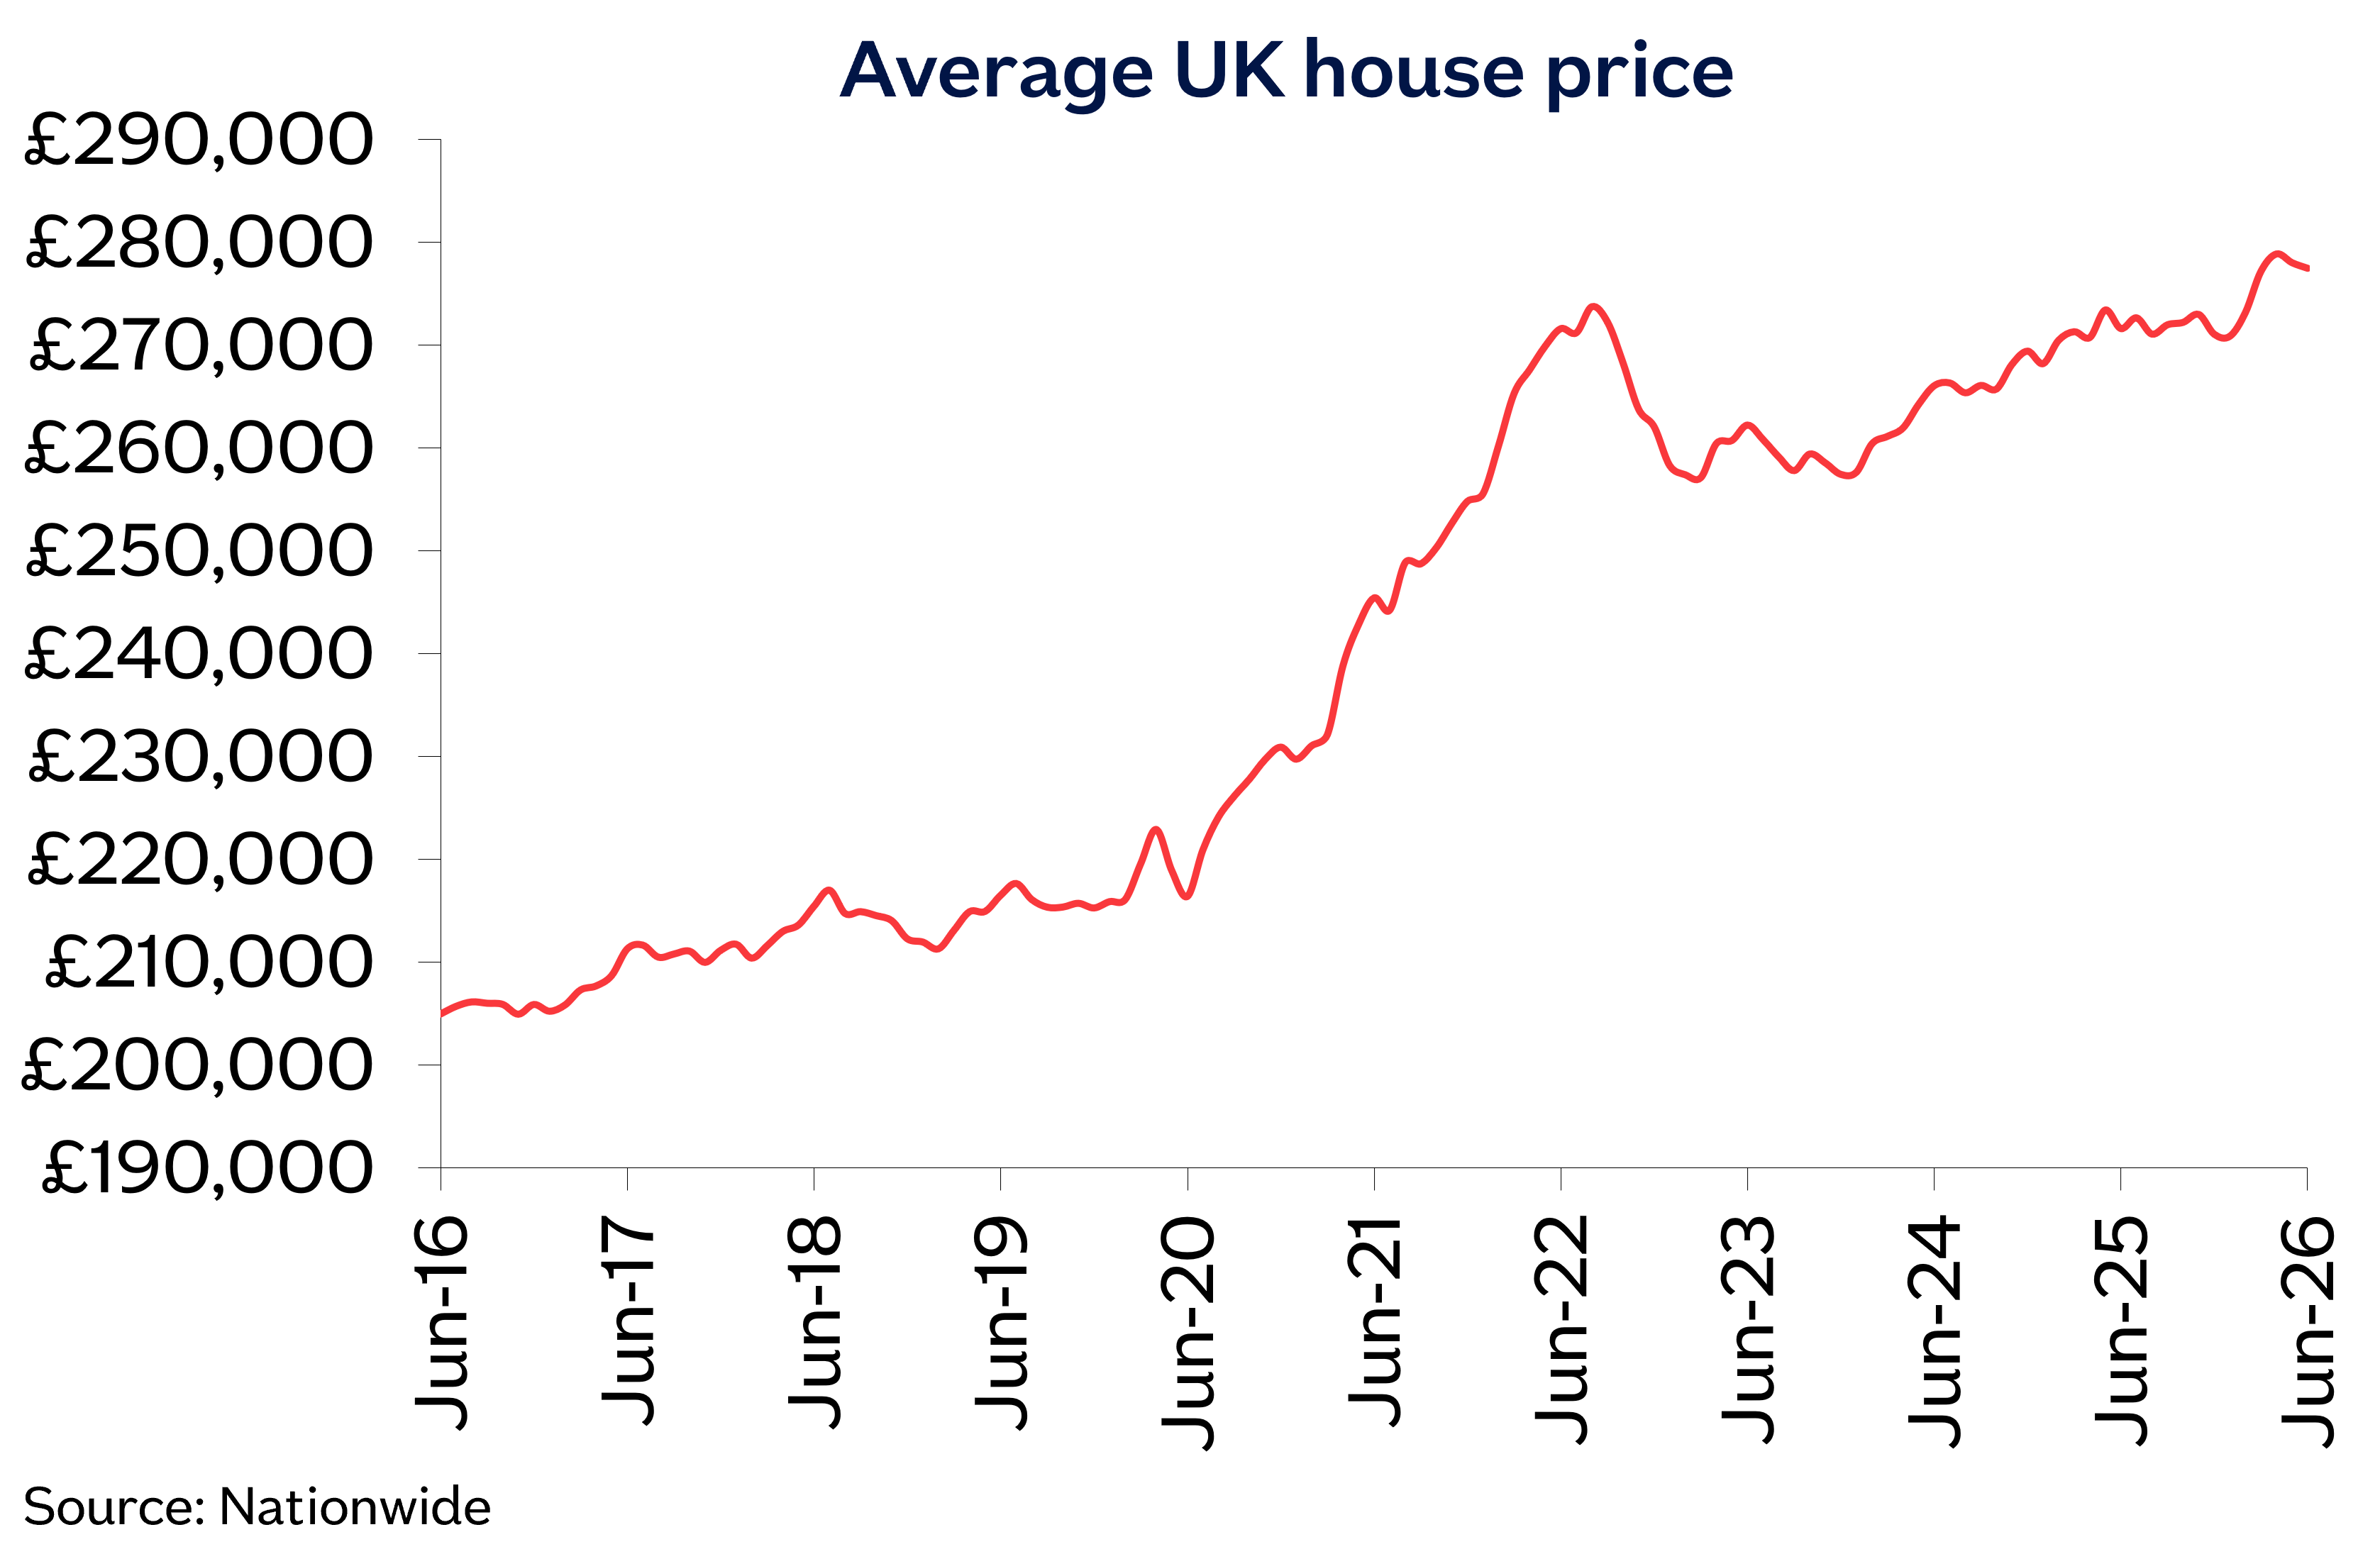
Annual growth reaches 2.2% in June, Nationwide reports

Annual house price growth in the UK strengthened to 2.2% in June, up from 1.7% in May, according to the latest Nationwide House Price Index, with the average price now at £277,484.
On a monthly basis, while the average house price stood at £278,024 in May, prices were largely unchanged once seasonal factors were taken into account.
Nationwide said the recent softening in market activity reflected uncertainty linked to developments in the Middle East, which had pushed up energy prices and market interest rates. Consumer confidence and housing sentiment had weakened as a result, and mortgage approvals fell noticeably in May.
 “While geopolitical tensions remain high, the signing of a memorandum of understanding between Iran and the US helped push oil prices back towards the levels prevailing before the conflict began,” said Robert Gardner (pictured right), chief economist at Nationwide.
“If maintained, these trends will help to restore household confidence and ease affordability constraints, paving the way for a recovery in housing market activity in the coming quarters, providing that domestic political uncertainty does not adversely impact sentiment.”
Nationwide added that easing energy costs could reduce the likelihood of further Bank Rate increases, a view reinforced by inflation figures that had come in below expectations in recent months. A shift in market expectations for the future path of Bank Rate had also helped bring down the swap rates underpinning fixed-rate mortgage pricing.
Northern Ireland continues to outpace other regions
Nationwide's quarterly regional figures showed all 13 UK regions recording positive annual price growth in the second quarter, with 12 of them within a range of 0% to 4%. Northern Ireland was the exception once again, recording annual growth of 8.6% — around four times the UK average of 2.2% — a trend Nationwide said echoed price movements in the border regions of Ireland.
“This persistently strong performance has resulted in a deterioration in housing affordability in the region, in contrast with the UK average, which has generally been improving,” Gardner said.
| Regions over the last 12 months | |||
| Region | Average price (Q2 2026) | Annual change | |
| Q2 2026 | Q1 2026 | ||
| Northern Ireland | £226,699 | 8.6% | 9.5% |
| North West | £231,415 | 3.9% | 3.3% |
| North | £173,756 | 3.9% | 2.6% |
| Scotland | £195,928 | 3.5% | 3.0% |
| Wales | £220,337 | 3.5% | 2.7% |
| West Midlands | £256,592 | 3.2% | 0.0% |
| Yorkshire and the Humber | £217,518 | 2.9% | 1.6% |
| East Midlands | £240,482 | 1.8% | 0.3% |
| London | £540,903 | 1.6% | 1.7% |
| South West | £310,429 | 0.7% | 0.1% |
| East Anglia | £274,375 | 0.3% | -0.4% |
| Outer Metropolitan Area | £432,173 | 0.3% | 1.0% |
| Outer South East | £341,175 | 0.1% | -0.7% |
| UK | £278,784 | 2.2% | 1.5% |
| Source: Nationwide | |||
According to the index, mortgage payments on a typical first-time buyer property in Northern Ireland now account for 31% of an average earner's take-home pay, up from 24% in the second quarter of 2022, though still below the UK average of 33%. The price of a typical home in the region has also risen to around 80% of the average UK price, up from 70% in the first quarter of 2024, but remains well short of the 125% peak recorded in 2007.
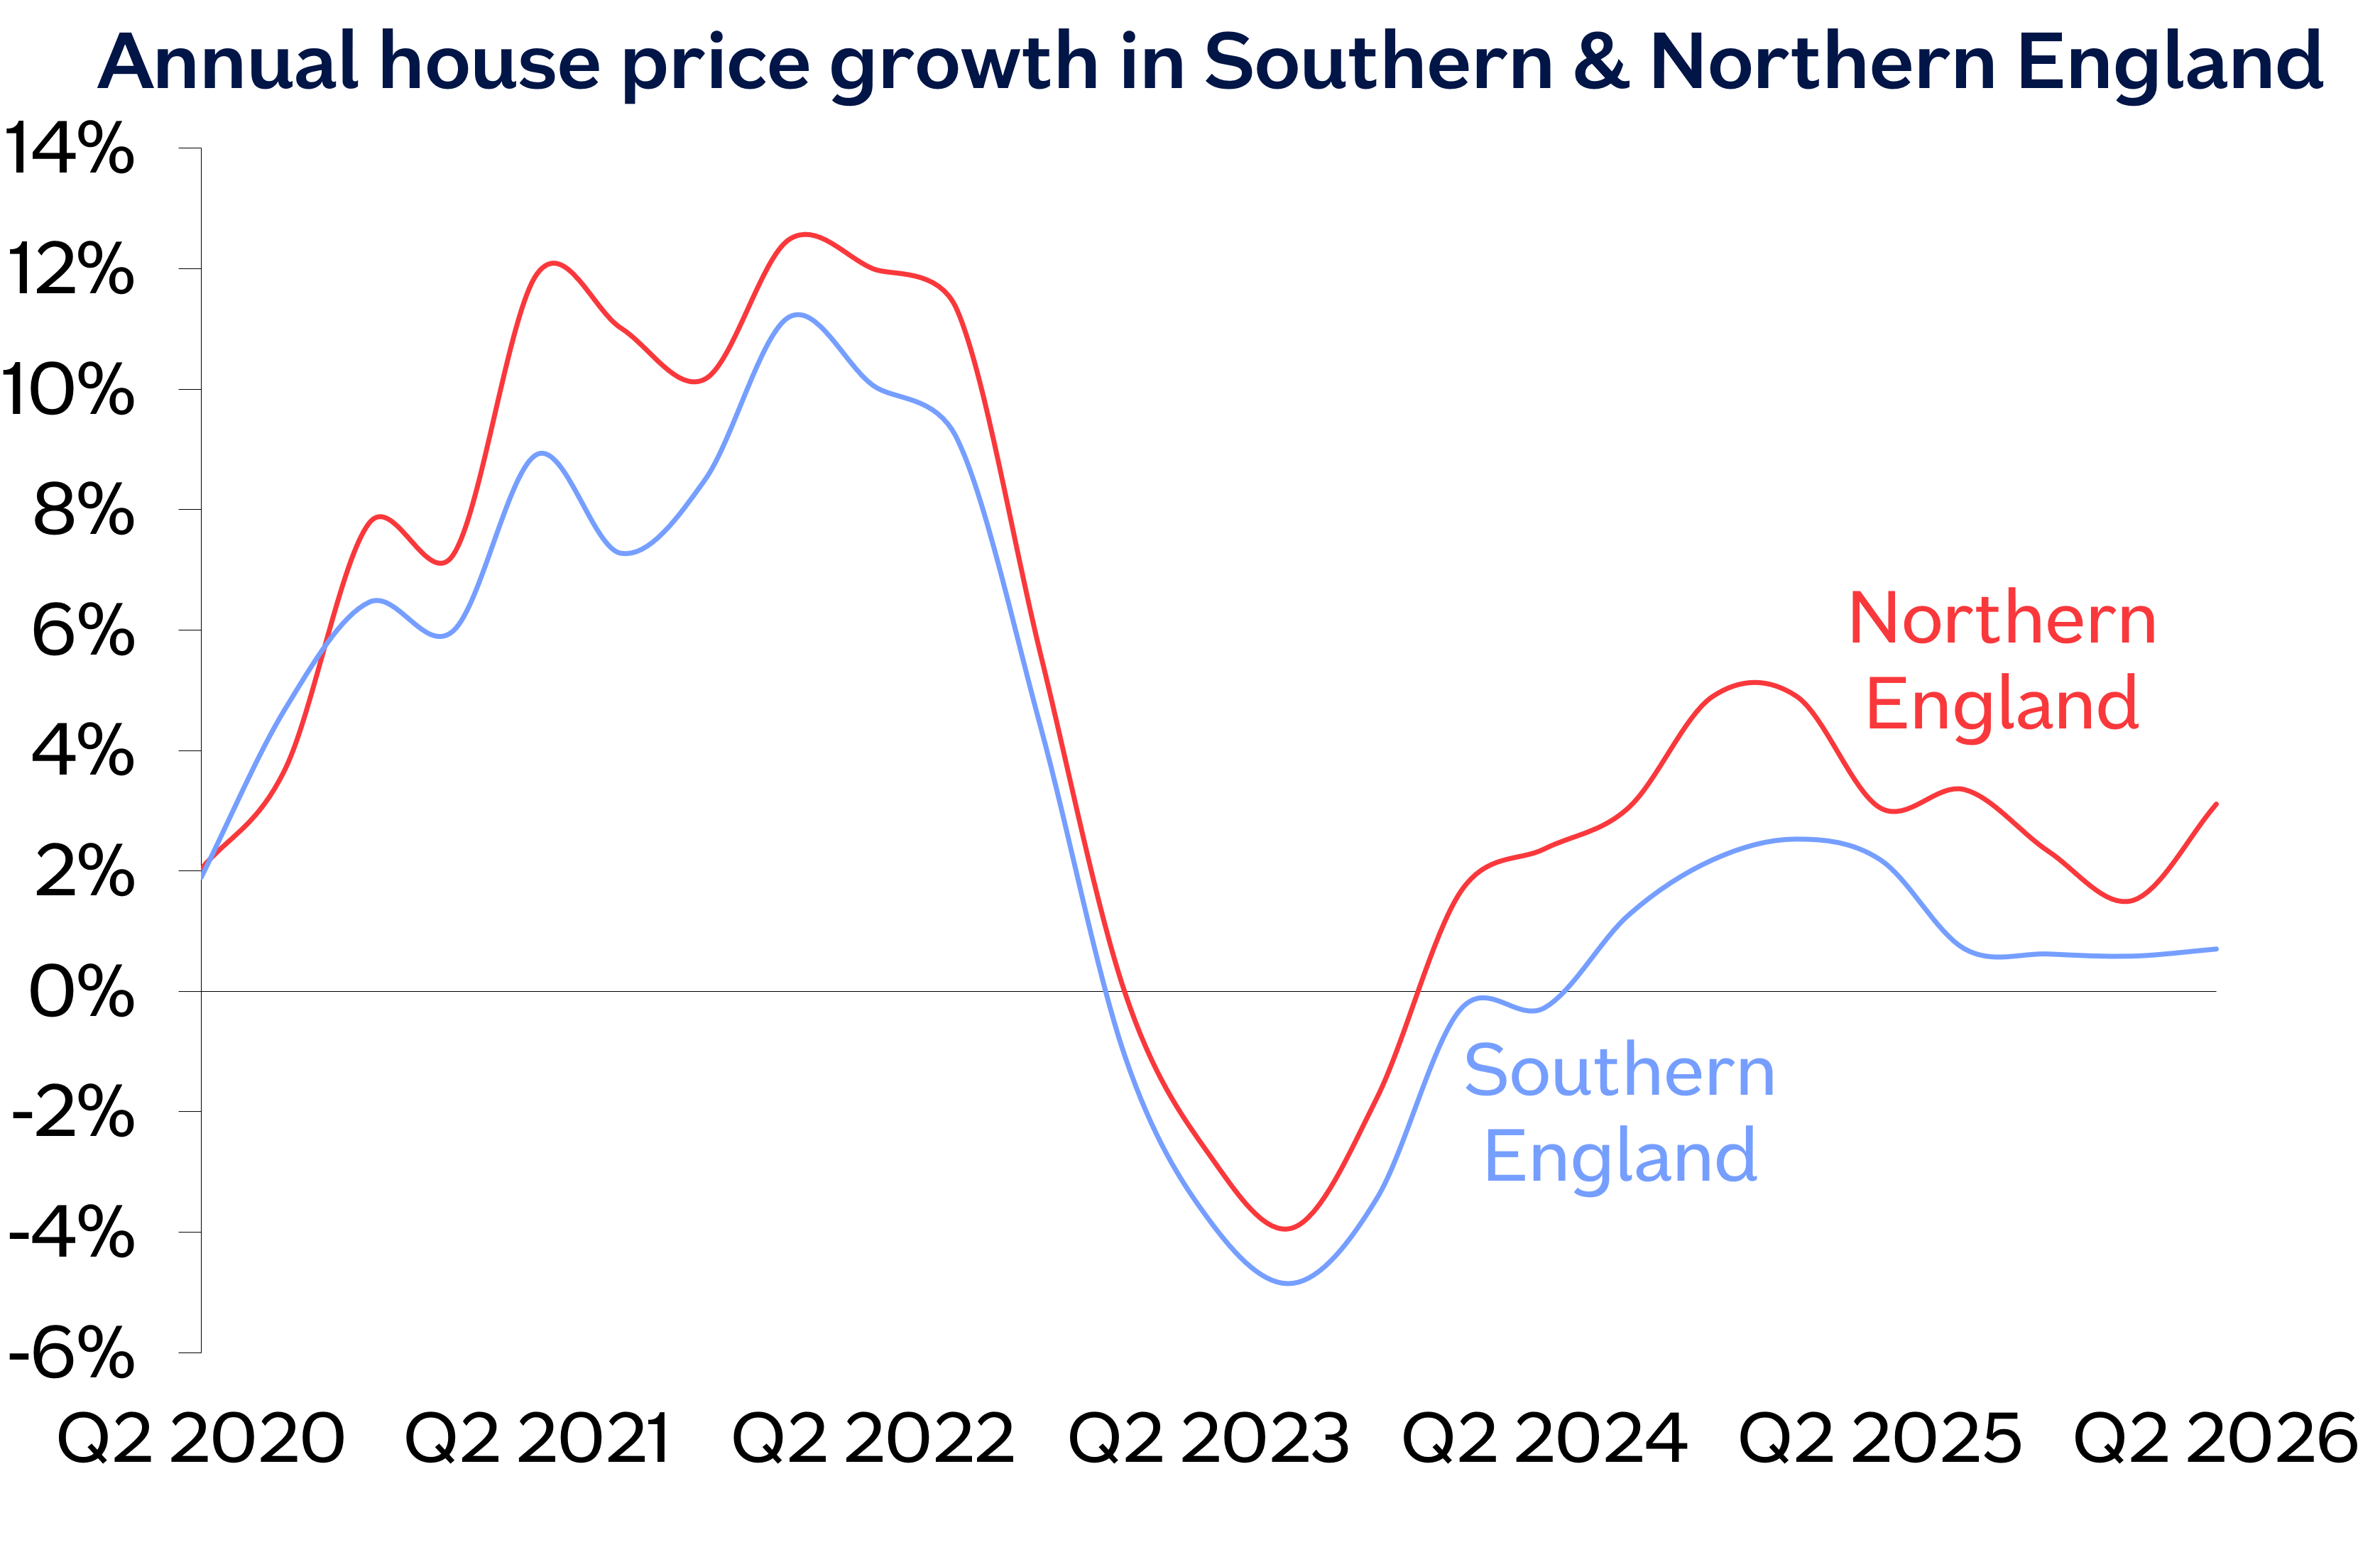
Elsewhere, Scotland and Wales both saw annual growth pick up to 3.5% in the second quarter, while England accelerated to 1.5%, from 0.9% in the first quarter.
Nationwide reported that Northern England outperformed the south, with prices up 3.1% year-on-year and the North West the strongest-performing English region at 3.9%. Growth across Southern England was more subdued, averaging 0.7%, with London the best-performing southern region at 1.6%, ahead of the Outer Metropolitan and Outer South East areas, which rose 0.3% and 0.1% respectively.
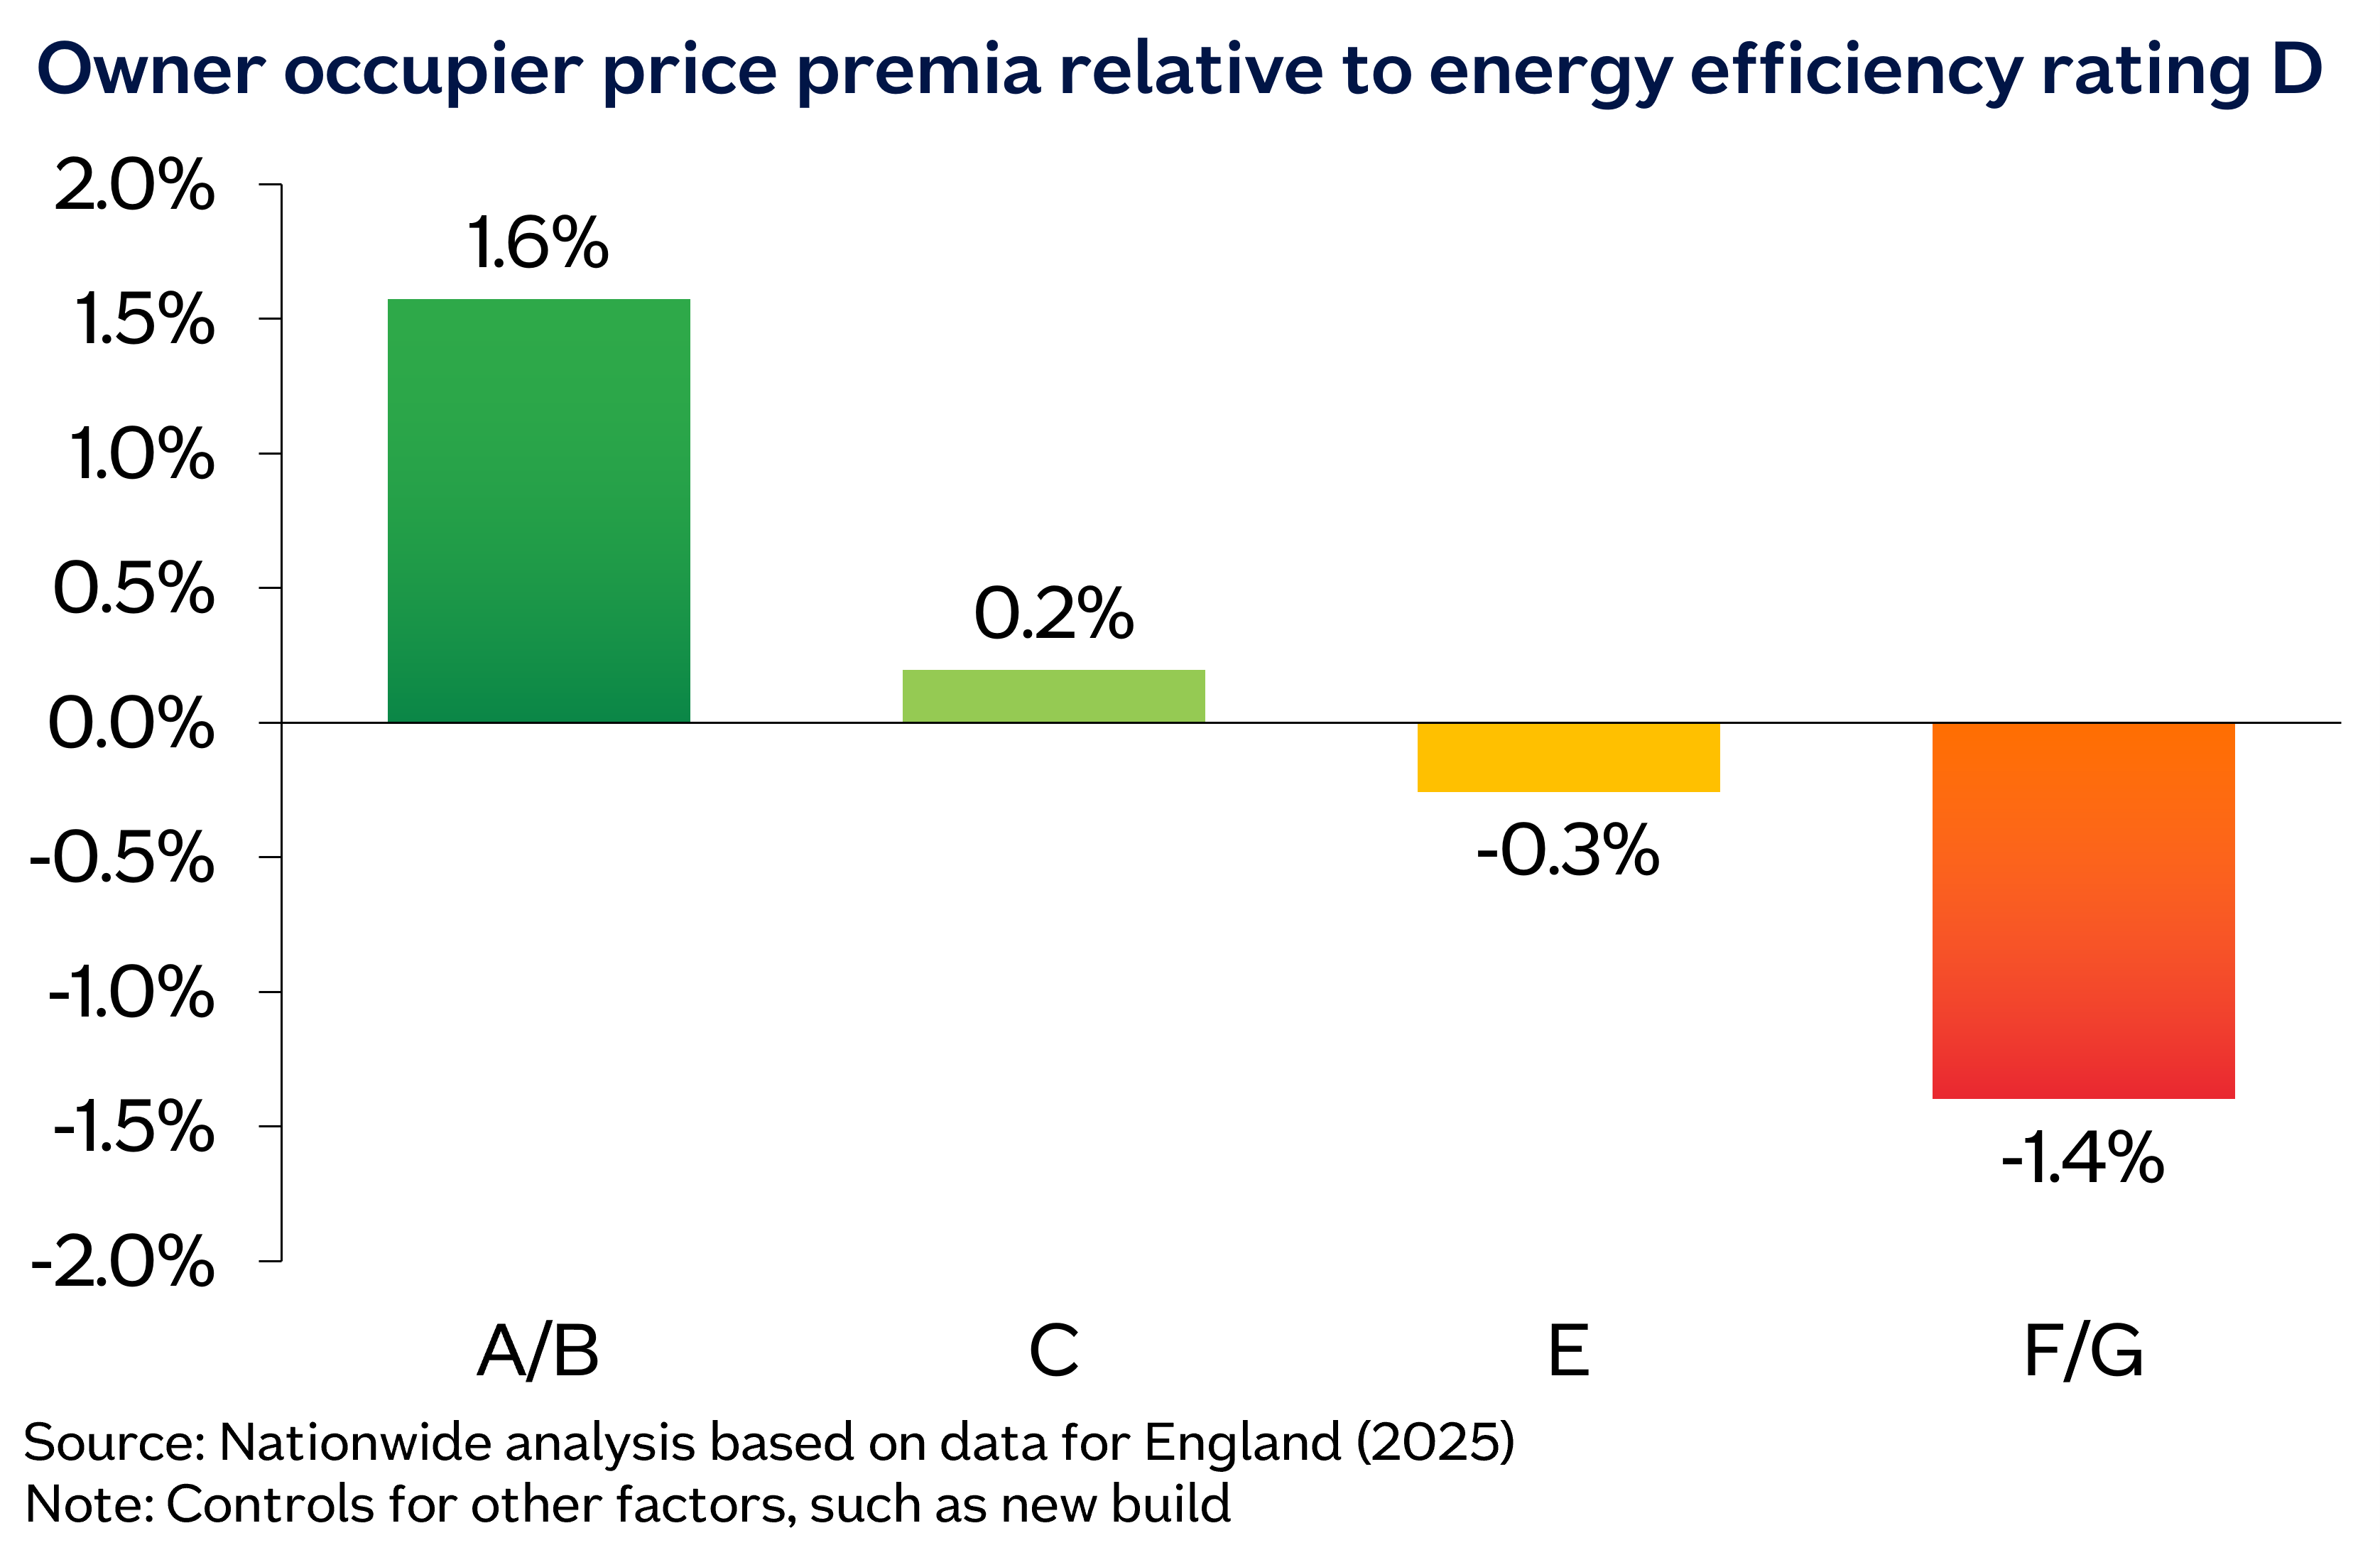
Energy efficiency shown to have modest effect on prices
Separate research from Nationwide examined the relationship between energy performance certificate (EPC) ratings and property values in England, accounting for factors such as bedroom number, location and whether a property was newly built.
The lender found that homes rated 'A' or 'B' commanded a premium of 1.6% over similar 'D'-rated properties, equivalent to roughly £4,500 based on average prices in England. Properties rated 'C' or 'E' showed little difference from 'D'-rated homes, while 'F'- and 'G'-rated properties were valued around 1.4% lower — about £4,000 in cash terms.
The effect was far more pronounced in the buy-to-let sector, where Nationwide said an 'A'- or 'B'-rated property attracted a 12.2% premium.
Nationwide's separate survey of homeowners found that 78% expected buyers to pay more for an energy-efficient home, with younger respondents most likely to hold this view — 32% of those aged 25 to 34, compared with 5% of those aged 55 and over. Some 69% of respondents said EPC ratings mattered more now than when they had bought their own home, although 54% did not know their current property's rating.
Looking ahead, 77% said EPC rating would be an important factor in a future purchase, rising to 49% among 25 to 34-year-olds who described it as “very important.”
Among homeowners who had made energy efficiency improvements in the past decade, the most common measures were solar panels, better insulation and upgraded windows and doors. The main motivations cited were lower energy bills (60%) and improved comfort (48%), with 73% reporting that bills had fallen as a result.
Nationwide noted this was consistent with data from the Department for Energy Security and Net Zero, which put median fuel costs for 'A', 'B' or 'C'-rated homes around £400 a year lower than 'D'-rated properties, and £1,200 lower than 'E'-rated properties.
Want to be regularly updated with mortgage news and features? Get exclusive interviews, breaking news, and industry events in your inbox – subscribe to our FREE daily newsletter. You can also follow us on Facebook, X (formerly Twitter), and LinkedIn.