There’s been a big drop in competitive offers

At the start of 2018 homebuyers were being highly-competitive in many US housing markets but things have changed.
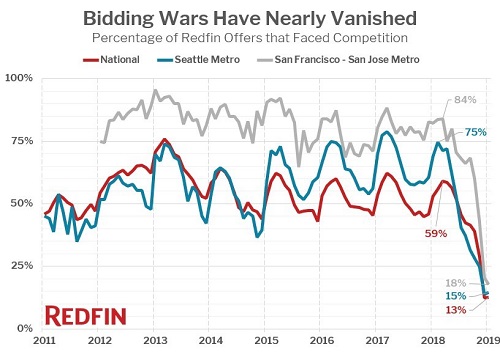
According to a new report from Redfin, there was competition for just 13% of offers written by its agents for buyers in January 2019, down from 53% a year earlier.
Buyers feel that they can take their time under current market conditions, making them more demanding; and that means sellers need to be more realistic.
"Buyers have heard that the market has slowed, so now they're trying to get all of their 'wants,' not just their 'needs,'" said Palo Alto Redfin agent Kalena Masching. "They're waiting until they find a home that can check more boxes—for instance three bedrooms instead of two or a higher rated school. In general, they are being more judicious as they think through their purchase. Meanwhile, many sellers have not yet recognized that the market has shifted."
Seattle and San Francisco were two of the most competitive markets in the 2018 spring buying season and 7 or 8 out of 10 sellers received multiple offers at the start of 2018; in January this year there was competition for fewer than 2 in 5 homes.
While Portland, Denver, and San Diego were the most competitive markets in January, there was competition for fewer than 1 in 5 Redfin offers, down from more than half a year earlier.
Bidding wars for Redfin-served markets
|
Rank |
Metro Area |
Share of |
Share of |
Share of |
|
1 |
Portland, OR |
19% |
53% |
8% |
|
2 |
Denver, CO |
19% |
54% |
17% |
|
3 |
San Diego, CA |
18% |
63% |
16% |
|
4 |
San Francisco, CA |
18% |
82% |
20% |
|
5 |
Raleigh, NC |
18% |
31% |
0% |
|
6 |
Los Angeles, CA |
16% |
73% |
14% |
|
7 |
Seattle, WA |
15% |
69% |
14% |
|
8 |
Boston, MA |
14% |
53% |
18% |
|
9 |
Phoenix, AZ |
14% |
43% |
12% |
|
10 |
Austin, TX |
14% |
25% |
5% |
|
11 |
Atlanta, GA |
12% |
41% |
6% |
|
12 |
Sacramento, CA |
11% |
58% |
4% |
|
13 |
Philadelphia, PA |
10% |
44% |
18% |
|
14 |
Washington, D.C. |
10% |
48% |
7% |
|
15 |
Chicago, IL |
10% |
39% |
12% |
|
16 |
Houston, TX |
6% |
40% |
11% |
|
17 |
Dallas, TX |
6% |
39% |
10% |
|
18 |
Miami, FL |
3% |
37% |
9% |