Four more years of sales data show the 'race for space' left a lasting mark on prices, while London's slide began well before Covid. The findings help explain why London flats are now the weakest part of the market

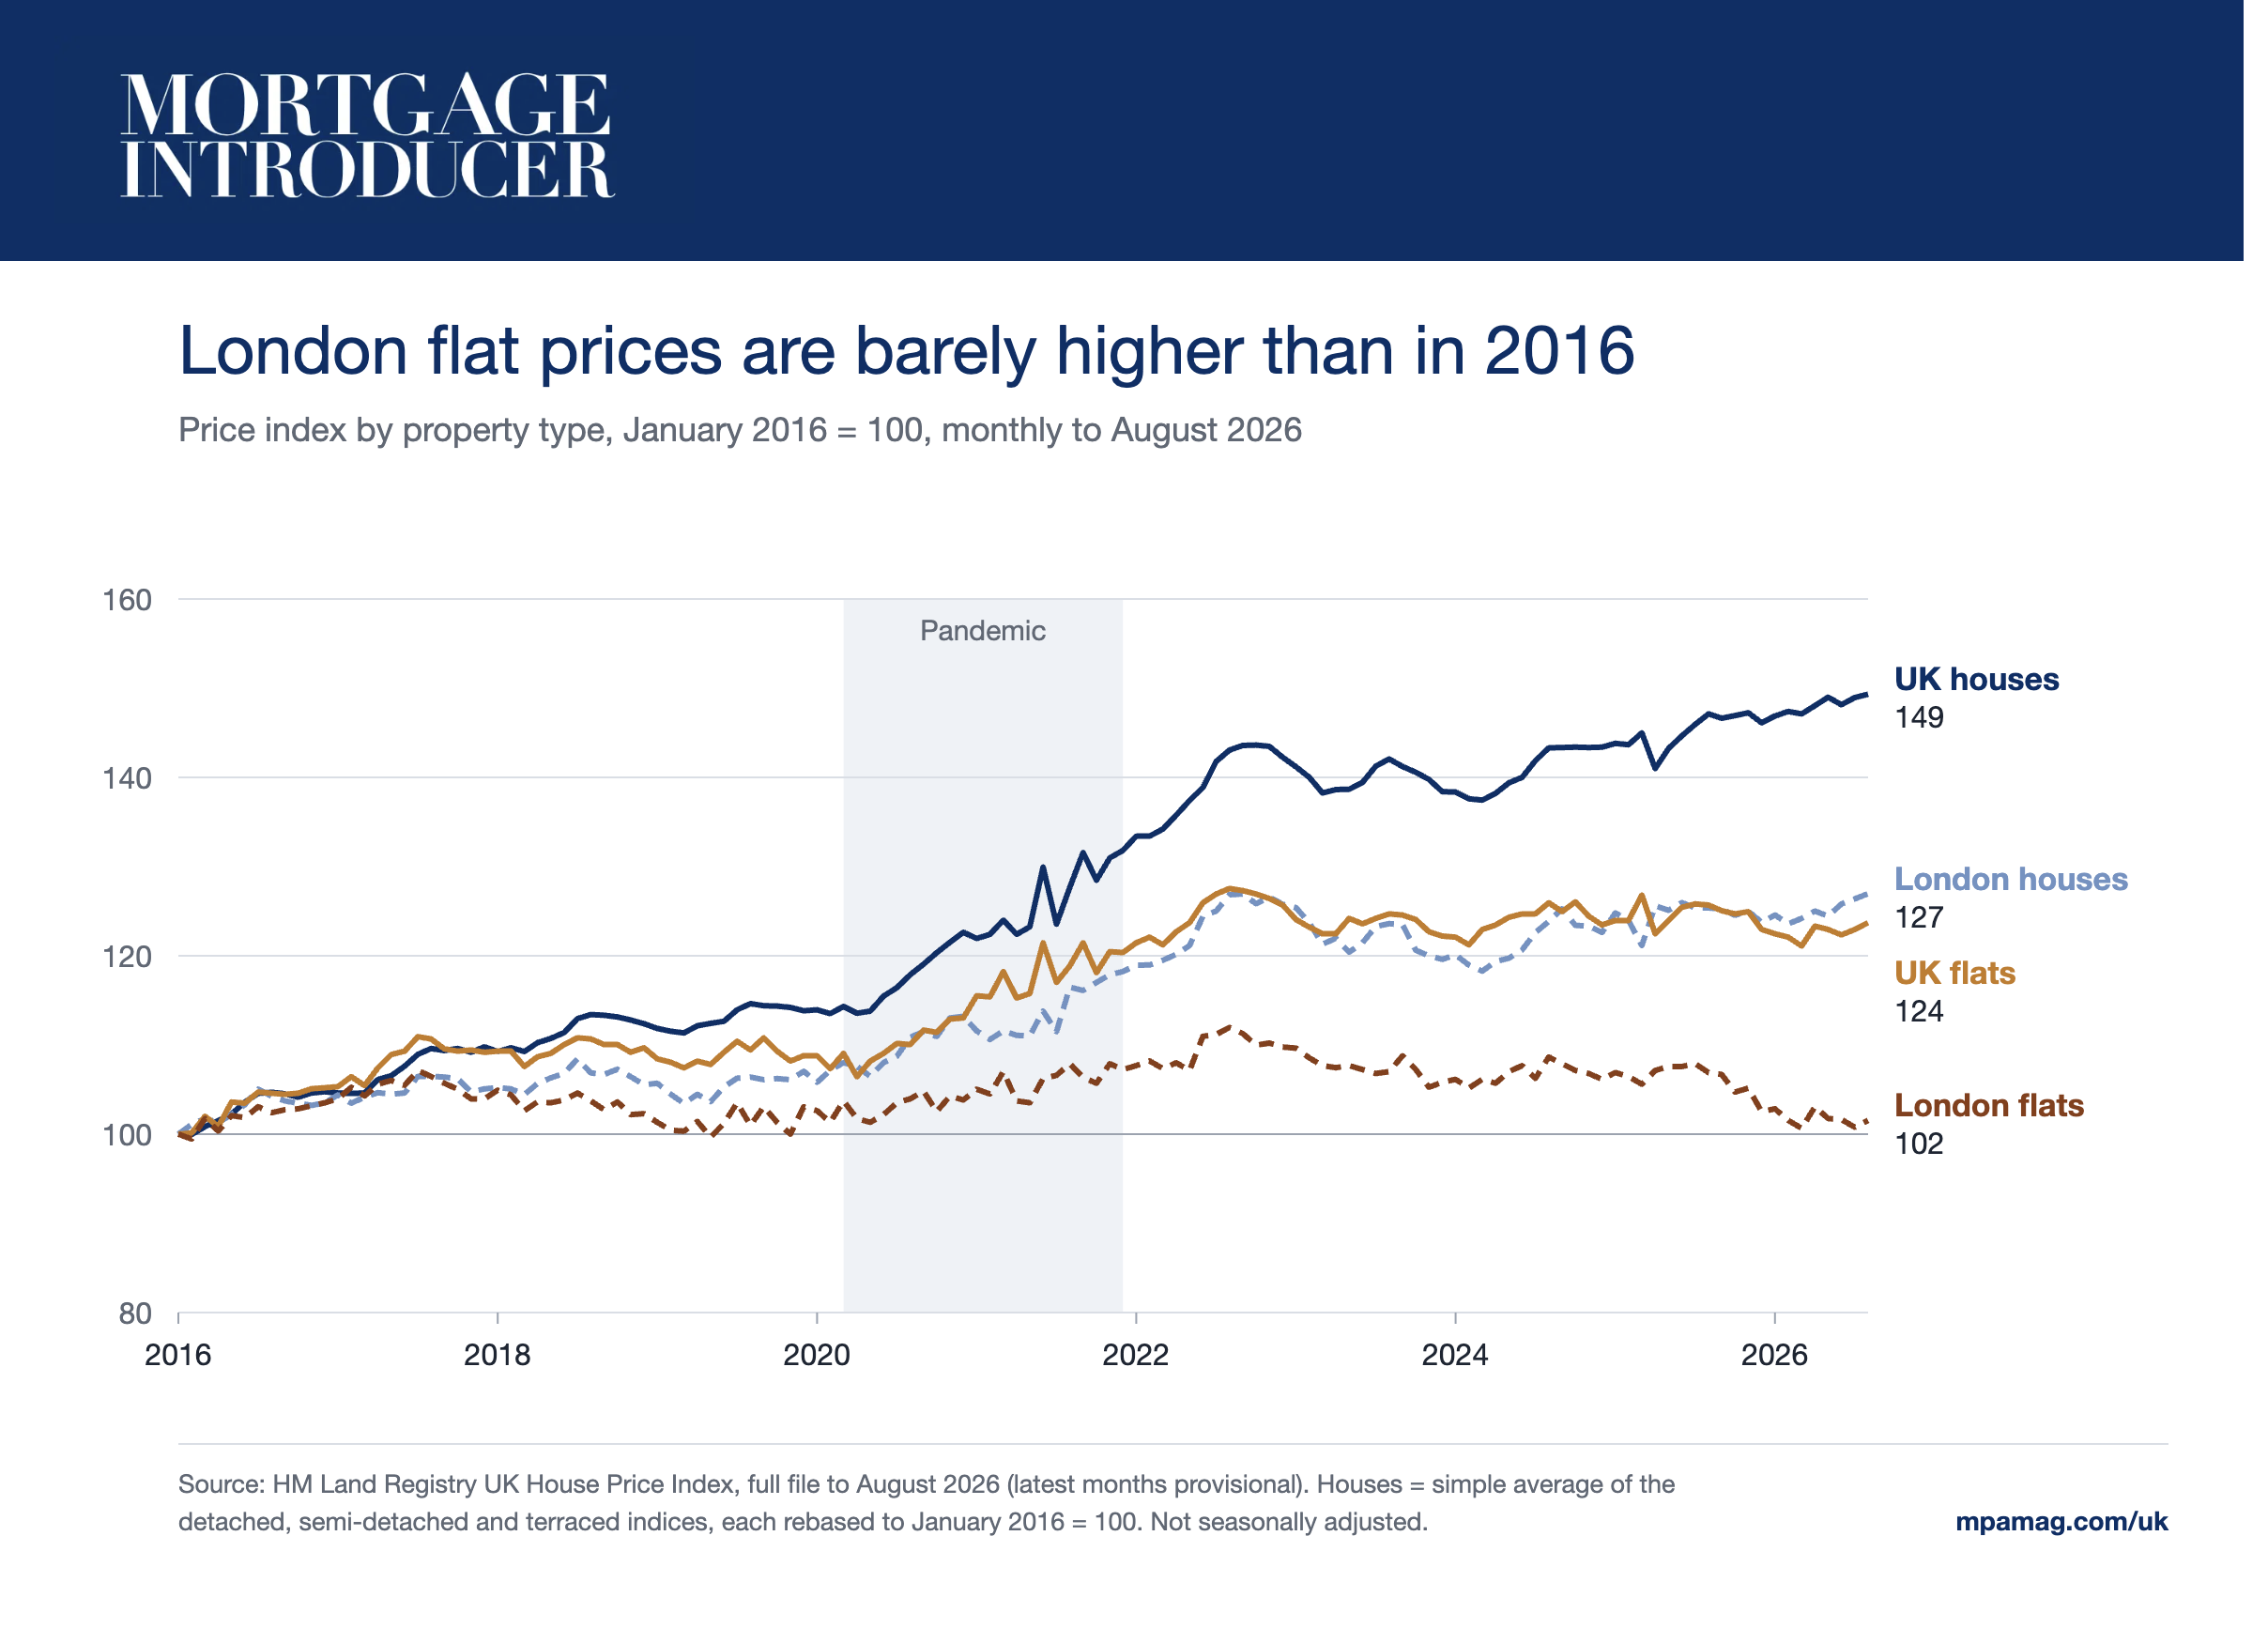
The extra amount buyers started paying for houses rather than flats during the pandemic has not faded, according to new research by Bank of England staff. It also finds that London's long run of weak price growth started before Covid, around 2016–17.
The analysis, by Eugenio Sanchez Pelayo and Gary Harper of the Bank's Data and Statistics Division, was published on the Bank's staff blog, Bank Underground, on 12 November. As with all posts on the blog, the views are the authors' own rather than the Bank's.
What the researchers did
The pair matched individual sales with property details from Energy Performance Certificates. They then estimated how much buyers paid for each feature of a home, such as type, number of rooms, floor area, new-build status and location, while holding the others constant. The method broadly follows the one the Office for National Statistics uses for its house price index.
Read next: Flats emerge as pressure point for lenders and brokers
The work picks up from a 2023 study by Martina Fazio and Harper, which found that during the pandemic houses gained value relative to similar flats, consistent with home working changing what buyers wanted. That data stopped in 2021, so it could not say whether the shift would last. The new study adds four years.
We’re happy to pay more for space
It has lasted. Detached, semi-detached and terraced houses all became more expensive relative to comparable flats during the pandemic, and none of that gap had closed by the end of the sample. The premium held after the stamp duty holiday ended in 2021, through the jump in mortgage rates in 2022 and through the slower sales that followed.
The authors flag one caveat. A further rise in the premium since June 2025 may be revised, because late registrations, especially of new builds, often change recent figures.
Read next: London's "two-speed" housing market deepens as prime prices stall
They say the persistence does not mean the gap cannot reverse, or that prices will stop responding to interest rates and incomes. But the end of pandemic conditions has not, on its own, brought back the old pattern.
London's slide started before Covid
The research separates London's weakness from the house-versus-flat effect. Once property features are accounted for, homes outside London were already gaining on comparable London homes from about 2016–17. That trend carried on after Covid, but more gradually than the sudden jump in the house premium.
The catch-up was biggest in Wales, the North West and the Midlands, with Yorkshire and the Humber close behind. The South East, East and South West stayed nearer London's prices. The North East moved little and was still the cheapest region relative to London at the end of the period.
London flats were on the losing side of both trends. The latest official figures bear that out. Flat prices in the capital fell 5% in the year to August, pulling London's overall average down 2.2%, according to the UK House Price Index for August 2026. Flats make up about half of London sales, against roughly a fifth across Great Britain. UK prices as a whole rose 0.9%, as covered in our report on house price growth slowing to 0.9%.
What drove the boom, the dip and the recovery
The authors also split annual price growth into its sources over three phases. During the pandemic boom, their measure grew by an average of 8.1% a year. In the 2023–24 dip it fell by an average of 1.8%, and in 2025 it rose 3.7%.
Read next: London property sellers more likely to sell at a loss
Changes in the prices attached to property type and location made up just over half of the boom and about four-fifths of the 2025 recovery. The 2023–24 dip was different. It mainly reflected a change in which homes were selling, with more sales of homes that lacked the features buyers pay most for, rather than a broad fall in prices.
The authors describe this as an accounting exercise rather than proof of cause. It cannot pick up changes in quality or demand that the recorded property details miss.
Why it matters for lending
The Bank's interest is in what headline price moves mean for affordability, mortgage collateral and financial stability. A fall driven by the mix of homes sold carries different risks from a fall in the value of the homes themselves.
For brokers, the gap between houses and flats is already showing up in cases. Weak flat values have made valuations and remortgages harder for some owners who bought after the pandemic, as our report on flats becoming a pressure point for lenders and brokers found. The Bank research suggests the gap is not a passing effect of the pandemic.
Resale figures point the same way. Across Great Britain, 26.7% of flats owned for five to ten years sold for less than their previous recorded price in the year to August 2026, against 2.2% of houses, according to e.surv analysis reported by Landlord Knowledge. London had the highest share, at 39.5%. Flats also made up about 90% of loss-making sales in the capital in 2025 while accounting for 60% of its transactions, Hamptons found, as our report on London sellers being more likely to sell at a loss showed. That leaves landlords with flat-heavy portfolios, and first-time buyers who bought small flats, with less equity than they may expect when they come to refinance or move.
The September house price index is due on 18 November.
Read next: House price growth slows to 0.9% as private rents hold at 3.8%