New claims that some markets are overvalued by 50%
When the UK property market started the year with its strongest January performance for 17 years, many pundits forecast that the boom might slow in pace, but that it would continue, albeit at more sustainable rates.
A new report, however, says that the London property market is overvalued by as much as 50%, stoking worries of a looming correction.
S&P Global Ratings, part of S&P Global, utilised long-term average property prices and compared them with income data to make the calculation, according to a report by The Telegraph.
Alastair Bigley, a researcher for S&P Global Ratings, told the publication that property prices were likely to fall.
“A combination of low rates, the stamp duty holiday and excess savings amid the pandemic have driven property prices higher, particularly in London and the South East, where overvaluation relative to income over the long term is as much as 50%,” Bigley said. “We expect a greater correction in an overvalued market.”
S&P estimated that property outside London was overvalued by 20%, The Telegraph reported.
Bigley said that house price gains were “a consistent trend” throughout the pandemic – a trend that wasn’t noticed initially due to the pandemic’s disruption to the international economy. Prices have also spiked across Europe since the beginning of the pandemic.
The overvaluation didn’t necessarily affect homeowners because higher house prices gave them more equity and minimised defaults, The Telegraph reported.
House prices in the UK hit a new record high on Monday, spiking nearly £6,000 in one month as buyers rushed to beat further rises in mortgage costs. The average home now costs £354,564, marking the first time asking prices have risen above £350,000, property website Rightmove reported.
The data came as homeowners increased their asking prices by an average of £5,760, or 1.7%, in March – the largest monthly rise in spring since 2004.
Rightmove’s Tim Bannister said that the market is expected to slow in the second half of 2022 as economic headwinds impact consumer confidence.
“We’ve just seen interest rates rise again, and there are further incremental increases forecast for the year which will raise mortgage rates for some,” Bannister said. “Inflation and cost-of-living increases are also likely to affect buyer affordability and market sentiment.”
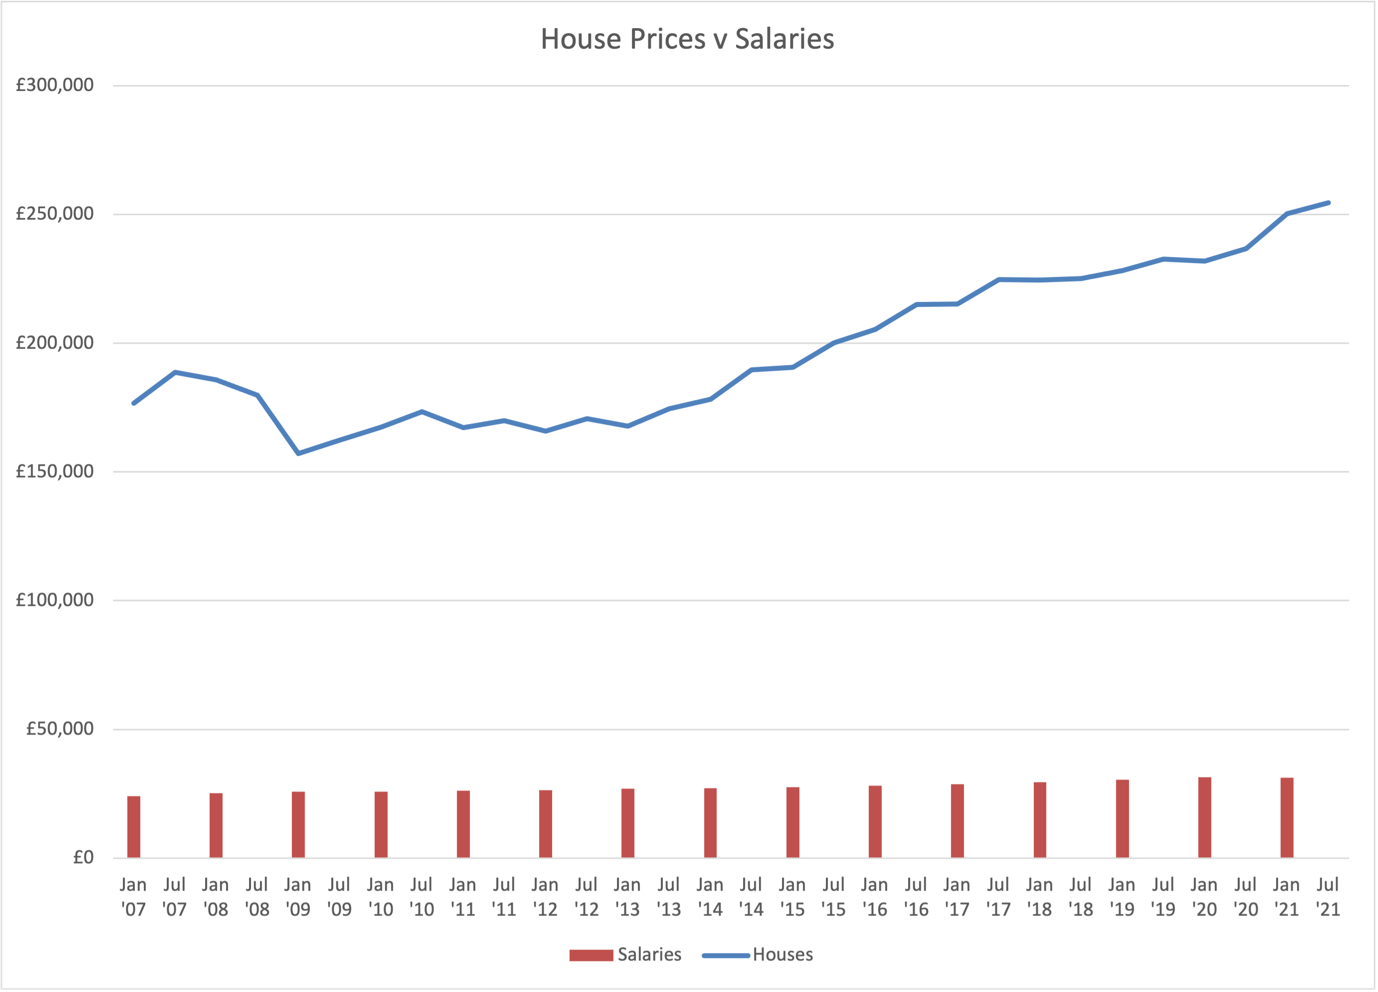
So how much have house prices risen?
This January, Nationwide announced that the average home price hit £255,556, an annualised rise of 11.2%. And even last October, the Office for National Statistics put that figure even higher at over £268,000.

|
Date |
Houses |
Salaries |
|---|---|---|
|
Jan '07 |
£176,758 |
£24,043 |
|
Jul '07 |
£188,691 |
|
|
Jan '08 |
£185,782 |
£25,165 |
|
Jul '08 |
£179,845 |
|
|
Jan '09 |
£157,234 |
£25,806 |
|
Jul '09 |
£162,423 |
|
|
Jan '10 |
£167,469 |
£25,882 |
|
Jul '10 |
£173,427 |
|
|
Jan '11 |
£167,300 |
£26,095 |
|
Jul '11 |
£169,866 |
|
|
Jan '12 |
£165,908 |
£26,472 |
|
Jul '12 |
£170,701 |
|
|
Jan '13 |
£167,716 |
£27,011 |
|
Jul '13 |
£174,592 |
|
|
Jan '14 |
£178,182 |
£27,215 |
|
Jul '14 |
£189,709 |
|
|
Jan '15 |
£190,665 |
£27,615 |
|
Jul '15 |
£200,142 |
|
|
Jan '16 |
£205,464 |
£28,195 |
|
Jul '16 |
£215,127 |
|
|
Jan '17 |
£215,243 |
£28,759 |
|
Jul '17 |
£224,719 |
|
|
Jan '18 |
£224,544 |
£29,559 |
|
Jul '18 |
£225,131 |
|
|
Jan '19 |
£228,314 |
£30,378 |
|
Jul '19 |
£232,711 |
|
|
Jan '20 |
£231,940 |
£31,487 |
|
Jul '20 |
£236,687 |
|
|
Jan '21 |
£250,249 |
£31,285 |
|
Jul '21 |
£254,554 |
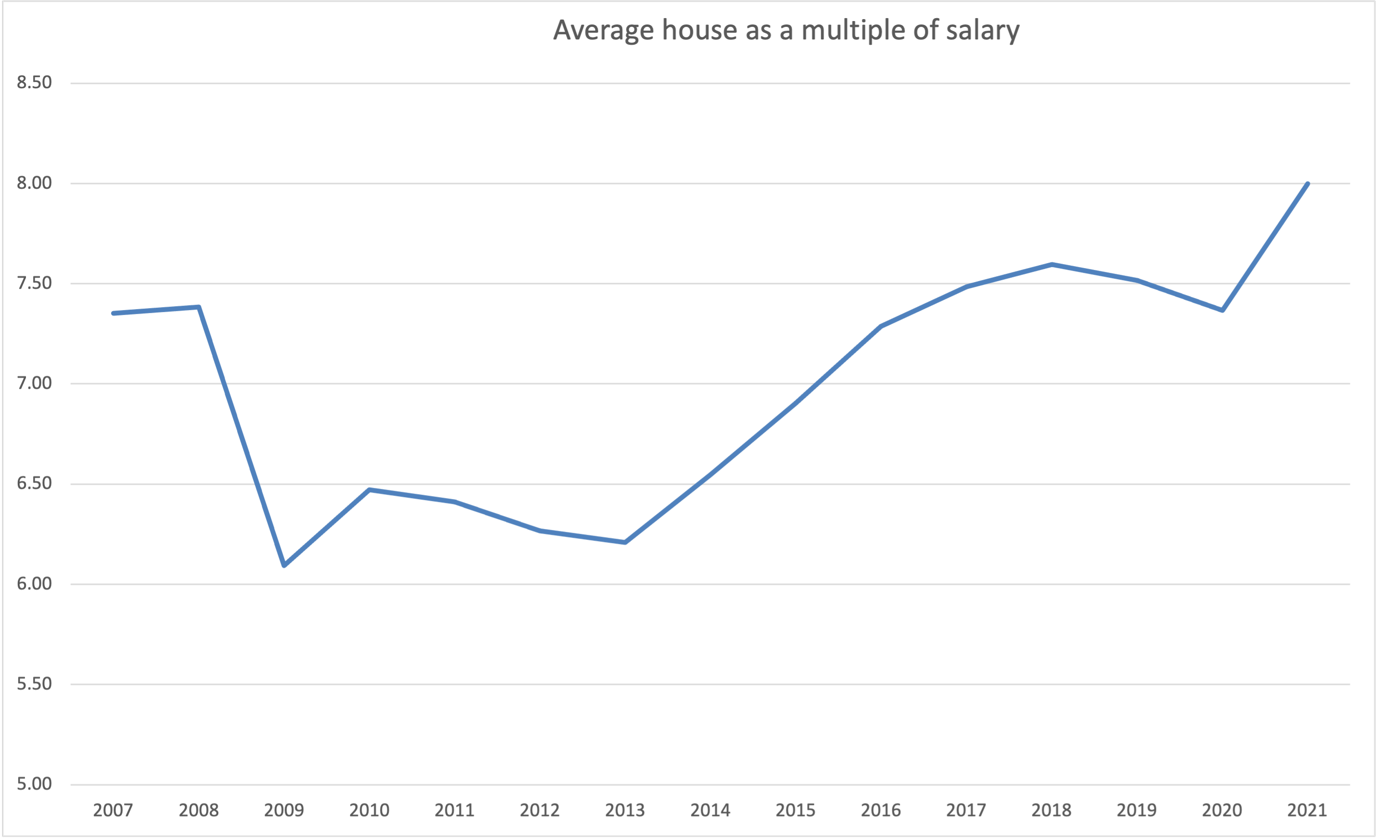
And how many times the average salary does the average house cost?
Immediately before the GFC, the average UK home would cost you nearly seven and a half times your salary – and that peak multiple was record-setting until 2016.
Following a dip back to the 2007 record as COVID bit, multiples have continued to rise setting new records, and breaching the 8x barrier in 2021.