We are seeing glimpses of positivity, chief says

Some parts of New Zealand saw sales volumes rise as confidence starts to return, while buyers and sellers in other areas continue to wait, the latest REINZ data showed.
REINZ CEO Jen Baird (pictured above) said as the winter months approach, glimpses of positivity start to show up, especially in the regions after the Reserve Bank announced the easing LVR and the stabilising of interest rates.
“It’s clear that current high interest rates combined with a tight economy, are still influencing the market as buyers continue to act with caution while economic headwinds play out,” Baird said.
“This month, median prices eased at a slower rate and sales counts are marginally down compared to May 2022. Seven regions increased in sales counts, an indicator of returning market confidence.”
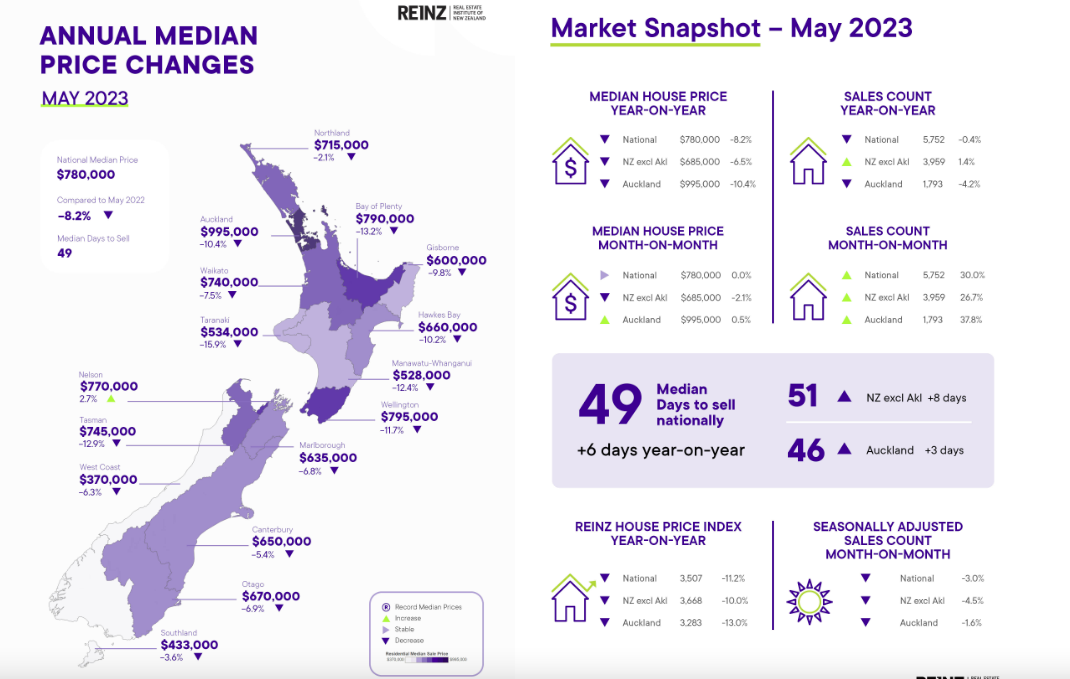
Nationally, the May median price dropped 8.2% on the prior year to $780,000 but remained flat month-on-month. The median time to sell was 49 days in May – longer by six days compared to last year, and up three days from the previous month. New Zealand excluding Auckland, saw median price contract by 6.5% to $685,000 and drop 2.1% month-on-month.
In the regions, Nelson saw the biggest jump in median price at 2.7% year-on-year and 6.9% month-on-month to $770,000. The West Coast lifted by a further 3.1% month-on-month. Two districts hit record median prices: Grey District with a 18.7% increase year on year ($400,000) and Waitomo District taking top spot with a 53.4% increase year on year ($655,000).
At the end of May, the total number of properties for sale across New Zealand was 26,685, up 250 properties (0.9%) year-on-year, and down 6.8% month-on-month. New Zealand, excluding Auckland, was also up from 15,799 to 17,015, an increase of 1,216 properties annually (+7.7%). Month-on-month, inventory decreased 7.3%.
“Inventory levels look to have stabilised with only a slight increase in stock levels,” Baird said. “We have seen low levels of property coming to market across the country for much of this year and, as sales volumes are back at more normal levels, we may be seeing the beginning of a shift in the balance of supply vs demand.”
In May, a total of 5,752 properties were sold across New Zealand, down -0.4% from 5,776 in May 2022, and up 30% compared to April. For New Zealand excluding Auckland, sales counts rose 1.4% year-on-year and 26.7% month-on-month.
Sales volumes in Northland, Auckland, Waikato, Wellington, Tasman, Marlborough, and Southland all had a 30% rise or more month-on-month, with Marlborough topping the list with 66.7% in sales.
“We do need to consider the typical changes that occur from April to May when interpreting the monthly sales count,” Baird said.
Of those seven regions, only Marlborough, Tasman, and Wellington outstripped what would typically be expected in May based on the sales counts of the previous month.
In Northland and Waikato, the increase in sales count from last month was slightly larger than typical, whereas the month-on-month movements in Auckland and Southland were less than what typically happens in those regions when moving from April to May.
“We’ve heard from salespeople that most sellers are meeting the market while others are potentially holding tight on selling at a higher sale price, particularly if they had bought in the peak of the market,” Baird said. “These tend to be the properties that stay on the market longer. Easing of loan-to-value restrictions, commentary around peak inflation and a renewed confidence is seeing more first home buyers seek out opportunities.”
Nationally, new listings numbered 7,359 in May, a 18.1% dip from 8,983 in May 2022 to 7,359 listings. Compared to April, listings climbed 3% from 7,142. For New Zealand excluding Auckland, there was a 17.4% fall in listings year-on-year from 5,801 to 4,792. Auckland’s listings tumbled 19.3% from 3,182 to 2,567 year-on-year, but up 2% month-on-month.
The REINZ House Price Index (HPI) for New Zealand, which measures the changing value of residential property across the country, showed an annual decline of -11.2% for New Zealand and a -10% drop for New Zealand excluding Auckland.
Click here for full Monthly Property Report
Click here for House Price Index (HPI) Report
Use the comment section below to tell us how you felt about this