Rental affordability remains relatively unchanged

Mortgage repayments have continued to eat up a large chunk of Kiwi households’ income, despite the generally improving housing affordability across New Zealand, as property values decline, incomes increase, and interest rates stabilise, according to a new CoreLogic report.
The latest CoreLogic Housing Affordability Report showed that mortgage repayments, as a percentage of gross annual average household income, fell to 49% last quarter, from a peak of 53% in Q4 2022, but remained well above the long-term average of 38%.
Kelvin Davidson (pictured above), CoreLogic NZ chief property economist, said the situation continued to be quite challenging for new buyers.
“Even after the recent improvements, almost half of a household’s income being eaten up by interest repayments is relatively unaffordable compared to long-term averages,” Davidson said. “Although lower mortgage rates seem likely over a one-to-two-year horizon, we’re not expecting any relief via rate cuts in the immediate to short-term.”
He said considering the uneasy prospect that property values may start increasing, albeit gradually, as already evident in a couple of regions, this will only add to the strain on new home buyers, at least until interest rates decline. Rising incomes will only partially offset this, Davidson added.
All main centres still have mortgage repayments as a percentage of gross household income that were at least eight percentage points higher than their long-term averages, with Tauranga the most stretched and Wellington the least, the CoreLogic data showed.
Value-to-income ratio still improving
New Zealand properties are now valued at 7.2 times the average household income, a 0.6 drop from 7.8 six months ago but was still above the long-term average of 6.1.
Davidson said the figure has fallen due to a dip in property values and increase in incomes, amidst the strong labour market backdrop.
“The latest figure of 7.2 is significantly lower than Q1 2022’s peak of 8.8 and is the lowest since 7.1 in Q4 2020,” he said. “In other words, a lot of the strain that emerged post-COVID has been easing but remains elevated by longer-term historical levels.”
Tauranga continued to hold on to its title as the least affordable main centre, with a value-to-income ratio of 9.5 in the second quarter, followed by Auckland, Dunedin, Hamilton, Christchurch, and Wellington.
“After a period of very stretched affordability, the sharp falls in Wellington City house prices lately have seen this part of the country get markedly better in terms of purchasing power and it retains the title of most affordable from Christchurch for the second consecutive report,” Davidson said.
Less years to save a deposit
CoreLogic data showed that saving for a deposit will now take 9.6 years, the lowest since Q4 2020 and two years better compared to the worst reading in Q1 2022 of 11.7 years, but still above the long-term average of 8.1.
The main centre where it would take the longest period to save for a deposit was in Tauranga, at 12.6 years. The figure is well above its long-term average of 10.8 years, and the national figure of 9.6 years. It has started to improve though, having peaked at 15.8 years in Q1 2022.
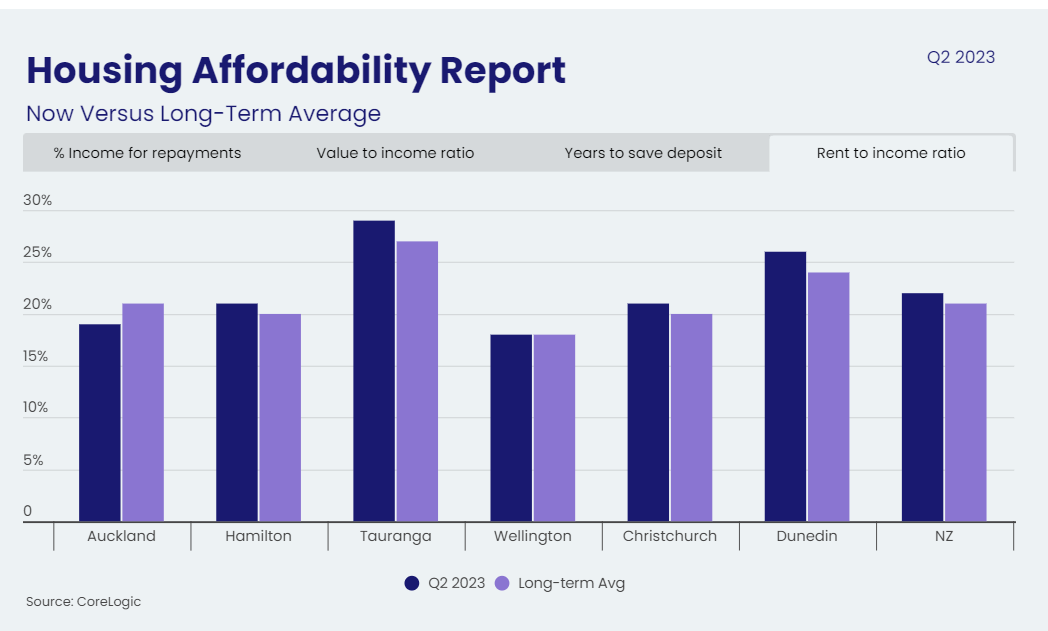
Rental affordability relatively unchanged
Rental affordability could have been improved by rising incomes, but generally speaking, that has been offset by rent growth.
“Indeed, at the national level, rents currently absorb 22% of average household income, a touch above the average, but at least not much different from where it’s been for the past few years,” Davidson said.
“The market that stands out is probably Christchurch, which has long been regarded as NZ’s most favourable main centre for housing affordability, both in terms of buying and renting, but this no longer applies to the same extent. Indeed, it’s now relatively more expensive to rent in Christchurch than Wellington, Auckland, and Hamilton.”
Download the Housing Affordability Report.
Use the comment section below to tell us how you felt about this.