Householders insurance has posted a negative underwriting result in four of the past ten quarters, including a catastrophic loss of $1.08 billion in December 2025. Premiums are up 18% in two years. It is not enough

There is no single line in the Australian general insurance market that better captures the industry's existential challenge than householders. The Australian Prudential Regulation Authority (APRA) quarterly data, released on May 29 2026 and covering September 2023 to March 2026, makes the structural problem impossible to ignore.
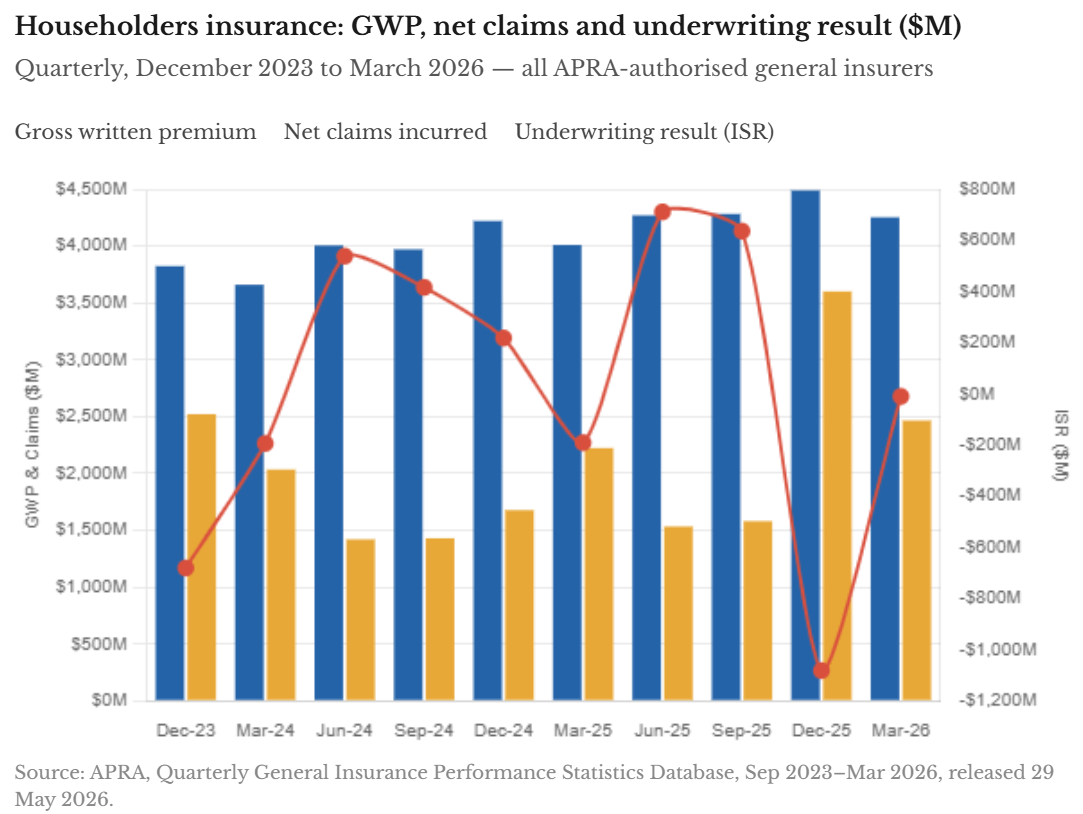
Gross written premium (GWP) for the householders class has grown from $3.82 billion in the December 2023 quarter to $4.49 billion in December 2025 - an increase of 17.4% in two years. Insurers have been raising prices steadily and consistently. By any normal market logic, profitability should have followed. It has not.
In four of the ten quarters captured in the dataset, the householders insurance service result - the underwriting profit or loss after reinsurance - was negative. The losses were $681 million (December 2023), $194 million (March 2025), $191 million (March 2025) and $1.08 billion (December 2025). That final figure, representing a single quarter in which claims consumed nearly 80 cents of every premium dollar written, is the worst underwriting result for any major class in the entire dataset.
The claims are not random, they are structural
The volatility in the householders line is not random noise. It maps directly onto Australia's catastrophe calendar. The good quarters - June 2025 ($711 million positive), September 2025 ($636 million positive) - coincide with relatively benign weather periods. The loss quarters coincide with event clusters.
Read next: The man who built a career on small bets is placing a big one on Santa Monica
“Insurance premiums are under pressure across the country due to escalating extreme weather costs, development in high-risk locations, a 40% rise in the cost of building materials since 2022, the growing value of our assets, and insurance taxes," said a spokesperson from the Insurance Council of Australia (ICA) to Insurance Business
In 2025 alone, ICA-declared extreme weather events cost $4.8 billion in insured losses from 294,000 claims.
The December 2025 quarter saw net claims of $3.6 billion against GWP of $4.49 billion. For context, in the June 2025 quarter - just two periods earlier - net claims were $1.53 billion against similar GWP. The same book of business, with broadly similar premium levels, produced a $711 million profit in one quarter and a $1.08 billion loss in the next but one.
That volatility reflects a climate risk profile that is changing faster than pricing models can adapt. A YouGov survey commissioned by the Climate Council found that 54% of insured respondents were concerned that bushfires, floods, and severe storms could make home insurance unaffordable or unavailable in their area. One in five said they may consider going without cover if premiums keep rising.
The ICA spokesperson drew attention to another factor that increases insurance costs for homeowners: “And in NSW, up to 37% of a premium is tax once you add GST, stamp duty and the Emergency Services Levy.”
Premiums are rising but the affordability crisis is real
The premium increases visible in the APRA GWP data are not abstract numbers. Finity data shows the average home insurance premium rose 51% between 2020 and October 2025, from $1,940 to $2,938. Darwin recorded the highest average capital city premium at $4,015, followed by Sydney at $3,964 and Brisbane at $3,872. Canstar figures show a further 14% increase in 2025 alone, with some locations seeing rises of up to 17%.
Read next: Australian home insurance premiums climb 51% in five years
The Australia Institute estimated in 2025 that approximately 1.4 million homes were either uninsured or underinsured. As Insurance Business has covered in depth, the protection gap is widening precisely as the risk it is meant to cover grows larger.
For brokers, the March 2026 quarter result offers no comfort. The householders ISR recovered to negative $10 million — technically better than December's catastrophe, but a line generating $4.25 billion in quarterly GWP and producing a $10 million loss is not a line in good health. Gallagher Bassett's 2026 Claims Insights report found that premium affordability and insurability rank as the leading business challenge for Australian insurers — a finding that the APRA data validates emphatically.
The ICA says the other concerning factor is that climate risks tend to impact those who can lease afford them.
“There is a clear correlation between high flood risk and socioeconomic status,” said the ICA spokesperson. “Around 70% of households exposed to the highest flood-risk are in areas where the median income is below the national median and 35% are in areas where the median income is below the poverty line.”
Many insurance industry stakeholders argue that the most effective way to ease this pressure on home insurance is to take risk out of the system through meaningful mitigation investment, paired with tax reform that takes cost out of the premium.
What brokers need to do now
However, now and in the years ahead this structural tension in the householders market has a direct implication for broker practice. When the line is simultaneously loss-making for insurers and increasingly unaffordable for consumers, the pressure on pricing will not abate — it will intensify. As Insurance Business has previously reported, construction costs have risen substantially — a building insured for $800,000 in 2021 may now cost $1.1 million to rebuild — meaning clients who have not reviewed their sums insured in recent years may be significantly underinsured at exactly the moment when claims are surging.
Brokers who are having proactive conversations about replacement cost assessments, policy review schedules, and the implications of underinsurance in a high-claims environment are doing their clients the most important service available in this market. The APRA data makes clear that the householders book has not stabilised. Until it does, those conversations cannot wait.
Source: APRA, Quarterly General Insurance Performance Statistics Database, September 2023 to March 2026, released May 29 2026. All figures are in Australian dollars and based on APRA-authorised general insurers. Lloyd's Australian operations are not included.